
A clear diagram is always welcome when you need to understand an infrastructure. But creating them by hand takes time: finding the right icons, positioning elements, drawing connections… What excites me today is the ability to automate all of that with AI.
In this article I show that it’s possible to use an AI agent with the Draw.io MCP to automatically generate AWS architecture diagrams. I use Claude Code in my setup, but this approach works with any MCP-compatible agent.
Starting point: updating an old diagram
I already had an article about this blog’s infrastructure from 2018 with a manually made Draw.io diagram. The infrastructure hasn’t changed much since — I basically added OAC (Origin Access Control) and a CloudFront Function — but the AWS icons have evolved and I wanted to update the diagram with the latest versions.
While looking for ways to automate this, I found the Draw.io MCP Server with its Chrome extension. I tried it… and liked it so much that I decided to write an article to share it!
The Draw.io MCP: controlling Draw.io with AI
The Draw.io MCP Server created by Ladislav (lgazo) is an MCP (Model Context Protocol) server that lets you control Draw.io programmatically. Concretely, this means an AI agent can create, modify, and organize elements in a Draw.io diagram.
Available tools
| Category | Tools | Usage |
|---|---|---|
| Inspection | get-selected-cell, list-paged-model | Read the canvas state |
| Creation | add-rectangle, add-edge, add-cell-of-shape | Add elements |
| Modification | edit-cell, edit-edge, set-cell-data | Modify existing elements |
| Library | get-shape-categories, get-shapes-in-category | Explore available shapes |
Required configuration
For the AI agent to communicate with Draw.io, you need to configure two elements as described in the project documentation:
- A local MCP server — configured in your agent’s settings file (e.g.
.mcp.jsonfor Claude Code) - The Draw.io MCP Chrome extension — which bridges the MCP server and the Draw.io application in the browser
Once those two elements are in place, the agent can directly manipulate the Draw.io canvas: create shapes, position them, draw connections — all programmatically.
When testing the Draw.io MCP, I found that you need to guide the agent to get a clean result: don’t invent resources, use the correct AWS icons, respect coherent positioning, apply colors by category, avoid HTML in texts… That’s why I created a Claude Code skill that encodes these rules.
Creating the skill /aws-diagram
A Claude Code skill is a Markdown file that defines a workflow and rules. When you invoke /aws-diagram, Claude Code loads these instructions and applies them automatically.
The workflow
The skill follows a 4-step process:
- Read the infrastructure code (Terraform, CloudFormation)
- Extract AWS resources and their relationships
- Build the diagram using official AWS icons
- Add connections with descriptive labels
📄 Skill excerpt: Workflow
## Workflow
1. **Read infrastructure code** (Terraform, CloudFormation, etc.)2. **Extract AWS resources** and their relationships3. **Build diagram** with official AWS icons4. **Add connections** with descriptive labels
Critical rules
I had to encode several important rules in the skill:
1. Never invent resources
This was the main trap. LLMs tend to “complete” what seems logical. “There’s CloudFront, so there should be Lambda@Edge for…” — No! The diagram must represent exactly what’s in the code, nothing more.
📄 Skill excerpt: Never invent
### NEVER invent resources
**Only diagram what actually exists in the infrastructure code.**
| Situation                  | Wrong                                         | Correct                                      || -------------------------- | --------------------------------------------- | -------------------------------------------- || No Lambda in Terraform     | Add Lambda@Edge because "it would make sense" | Don't add Lambda                             || CloudFront Function exists | Use Lambda icon                               | Use CloudFront icon with "CF Function" label || No WAF configured          | Add WAF for "security"                        | Don't add WAF                                |
2. Users are external
“Users” are not AWS resources. They must appear outside the AWS Cloud group.
📄 Skill excerpt: External users
### Users OUTSIDE the AWS Cloud
**Users are NOT AWS resources.** They represent external actors.
WRONG:┌─────────────────────────────────┐│ AWS Cloud ││ [Users] → [Route53] → [CF] │ ❌ Users inside cloud└─────────────────────────────────┘
CORRECT:[Users] → ┌─────────────────────────┐│ AWS Cloud ││ [Route53] → [CF] → [S3] │ ✅ Users outside└─────────────────────────┘
3. No HTML in texts
Draw.io does not render HTML. If you write text: "S3<br>Private", you will literally see <br> in the diagram.
📄 Skill excerpt: No HTML
### NEVER use HTML in text parameters
Draw.io does NOT render HTML tags in text fields. They display as raw text.
**FORBIDDEN (will show ugly raw HTML):**
text: "S3 Bucket<br>Private" ❌ Shows "<br>" literallytext: "Route 53 DNS" ❌ Shows " " literallytext: "<font color='red'>ACM</font>" ❌ Shows raw HTML tags
**CORRECT (clean text):**
text: "S3 Bucket" ✅ Single line, cleantext: "Route 53" ✅ Service name onlytext: "ACM" ✅ Simple label4. Plan the layout to avoid collisions
Crossing edges make the diagram unreadable. The skill recommends placing the main flow on a horizontal line, and auxiliary services above or below.
📄 Skill excerpt: Layout and collisions
### Rule 1: Main Flow on a Horizontal Line
Place the primary data flow (request path) on a single horizontal row:
[Entry] → [Service A] → [Service B] → [Service C]y=300 y=300 y=300 y=300
### Rule 2: Auxiliary Services Above or Below
Services that connect TO a main service (not part of the flow) go above or below:
        [Auth]     [Edge Logic]     ← Auxiliary row (y=150)           \           /            \         /             ↓       ↓
[Entry] → [Gateway] → [Compute] → [Storage] ← Main flow (y=300)
5. Annotations on the right, not below
AWS icons have their label automatically placed below. If you add annotations below as well, they will overlap the next line. Place them to the right of the icon.
📄 Skill excerpt: Annotation placement
### Annotation Placement Rules
**CRITICAL: Place annotations to the RIGHT of icons, not below.**
**WRONG - Annotations below icons:**
[CloudFront] [S3]|"Cache Policies" ← Overlaps with next row!"Security Headers"|[CloudFront Preview] ← Collision!
**CORRECT - Annotations to the RIGHT:**
[CloudFront] ── "Cache Policies: HTML 0s | Assets 1y"| "Security: CSP | HSTS"↓[CloudFront Preview] ← No collision
The color system
I defined a palette consistent with AWS conventions:
| Category | Color | Services |
|---|---|---|
| Networking | #8C4FFF (purple) | Route53, CloudFront, VPC |
| Storage | #7AA116 (green) | S3, EFS |
| Security | #DD344C (red) | ACM, IAM, WAF |
| Compute | #ED7100 (orange) | Lambda, EC2 |
For data flows, I use environment-based colors:
- Production : green
#4CAF50 - Preview : orange
#FF9800 - Configuration : gray
#AAAAAA(dashed)
📄 Skill excerpt: Colors and styles
### Colors by Category
| Category       | Color               | Services                                   || -------------- | ------------------- | ------------------------------------------ || **Networking** | `#8C4FFF` (violet)  | Route53, CloudFront, VPC, ELB, API Gateway || **Compute**    | `#ED7100` (orange)  | Lambda, EC2, ECS, Fargate                  || **Storage**    | `#7AA116` (green)   | S3, EFS, EBS                               || **Database**   | `#C925D1` (magenta) | RDS, DynamoDB, ElastiCache                 || **Security**   | `#DD344C` (red)     | ACM, IAM, WAF, Cognito                     || **General**    | `#232F3D` (gray)    | Users, Generic                             |
### AWS Icon Style Template
sketch=0;outlineConnect=0;fontColor=#232F3E;fillColor=<COLOR>;strokeColor=#ffffff;dashed=0;verticalLabelPosition=bottom;verticalAlign=top;align=center;html=1;fontSize=12;fontStyle=0;aspect=fixed;shape=mxgraph.aws4.resourceIcon;resIcon=mxgraph.aws4.<SERVICE>;
### Edge Colors by Environment
| Environment   | Color     | Usage                  || ------------- | --------- | ---------------------- || Production    | `#4CAF50` | Main production flow   || Preview       | `#FF9800` | Staging environments   || Configuration | `#AAAAAA` | Dashed, non-data links |
Practical application: the jls42.org infrastructure
To test the skill, I used it on this blog’s infrastructure.
Terraform code analyzed
terraform/├── cloudfront-astro.tf # Distribution CloudFront prod├── s3-astro.tf # Bucket S3 privé avec OAC├── acm-astro.tf # Certificat SSL├── route53.tf # DNS└── variables.tf # VariablesExtracted architecture
| Component | AWS Service | Configuration |
|---|---|---|
| DNS | Route 53 | Zone jls42.org, 3 domains |
| CDN | CloudFront | OAC, CF Function, cache policies |
| Storage | S3 | Private bucket, AES256, OAC only |
| TLS | ACM | Certificate in us-east-1, DNS validation |
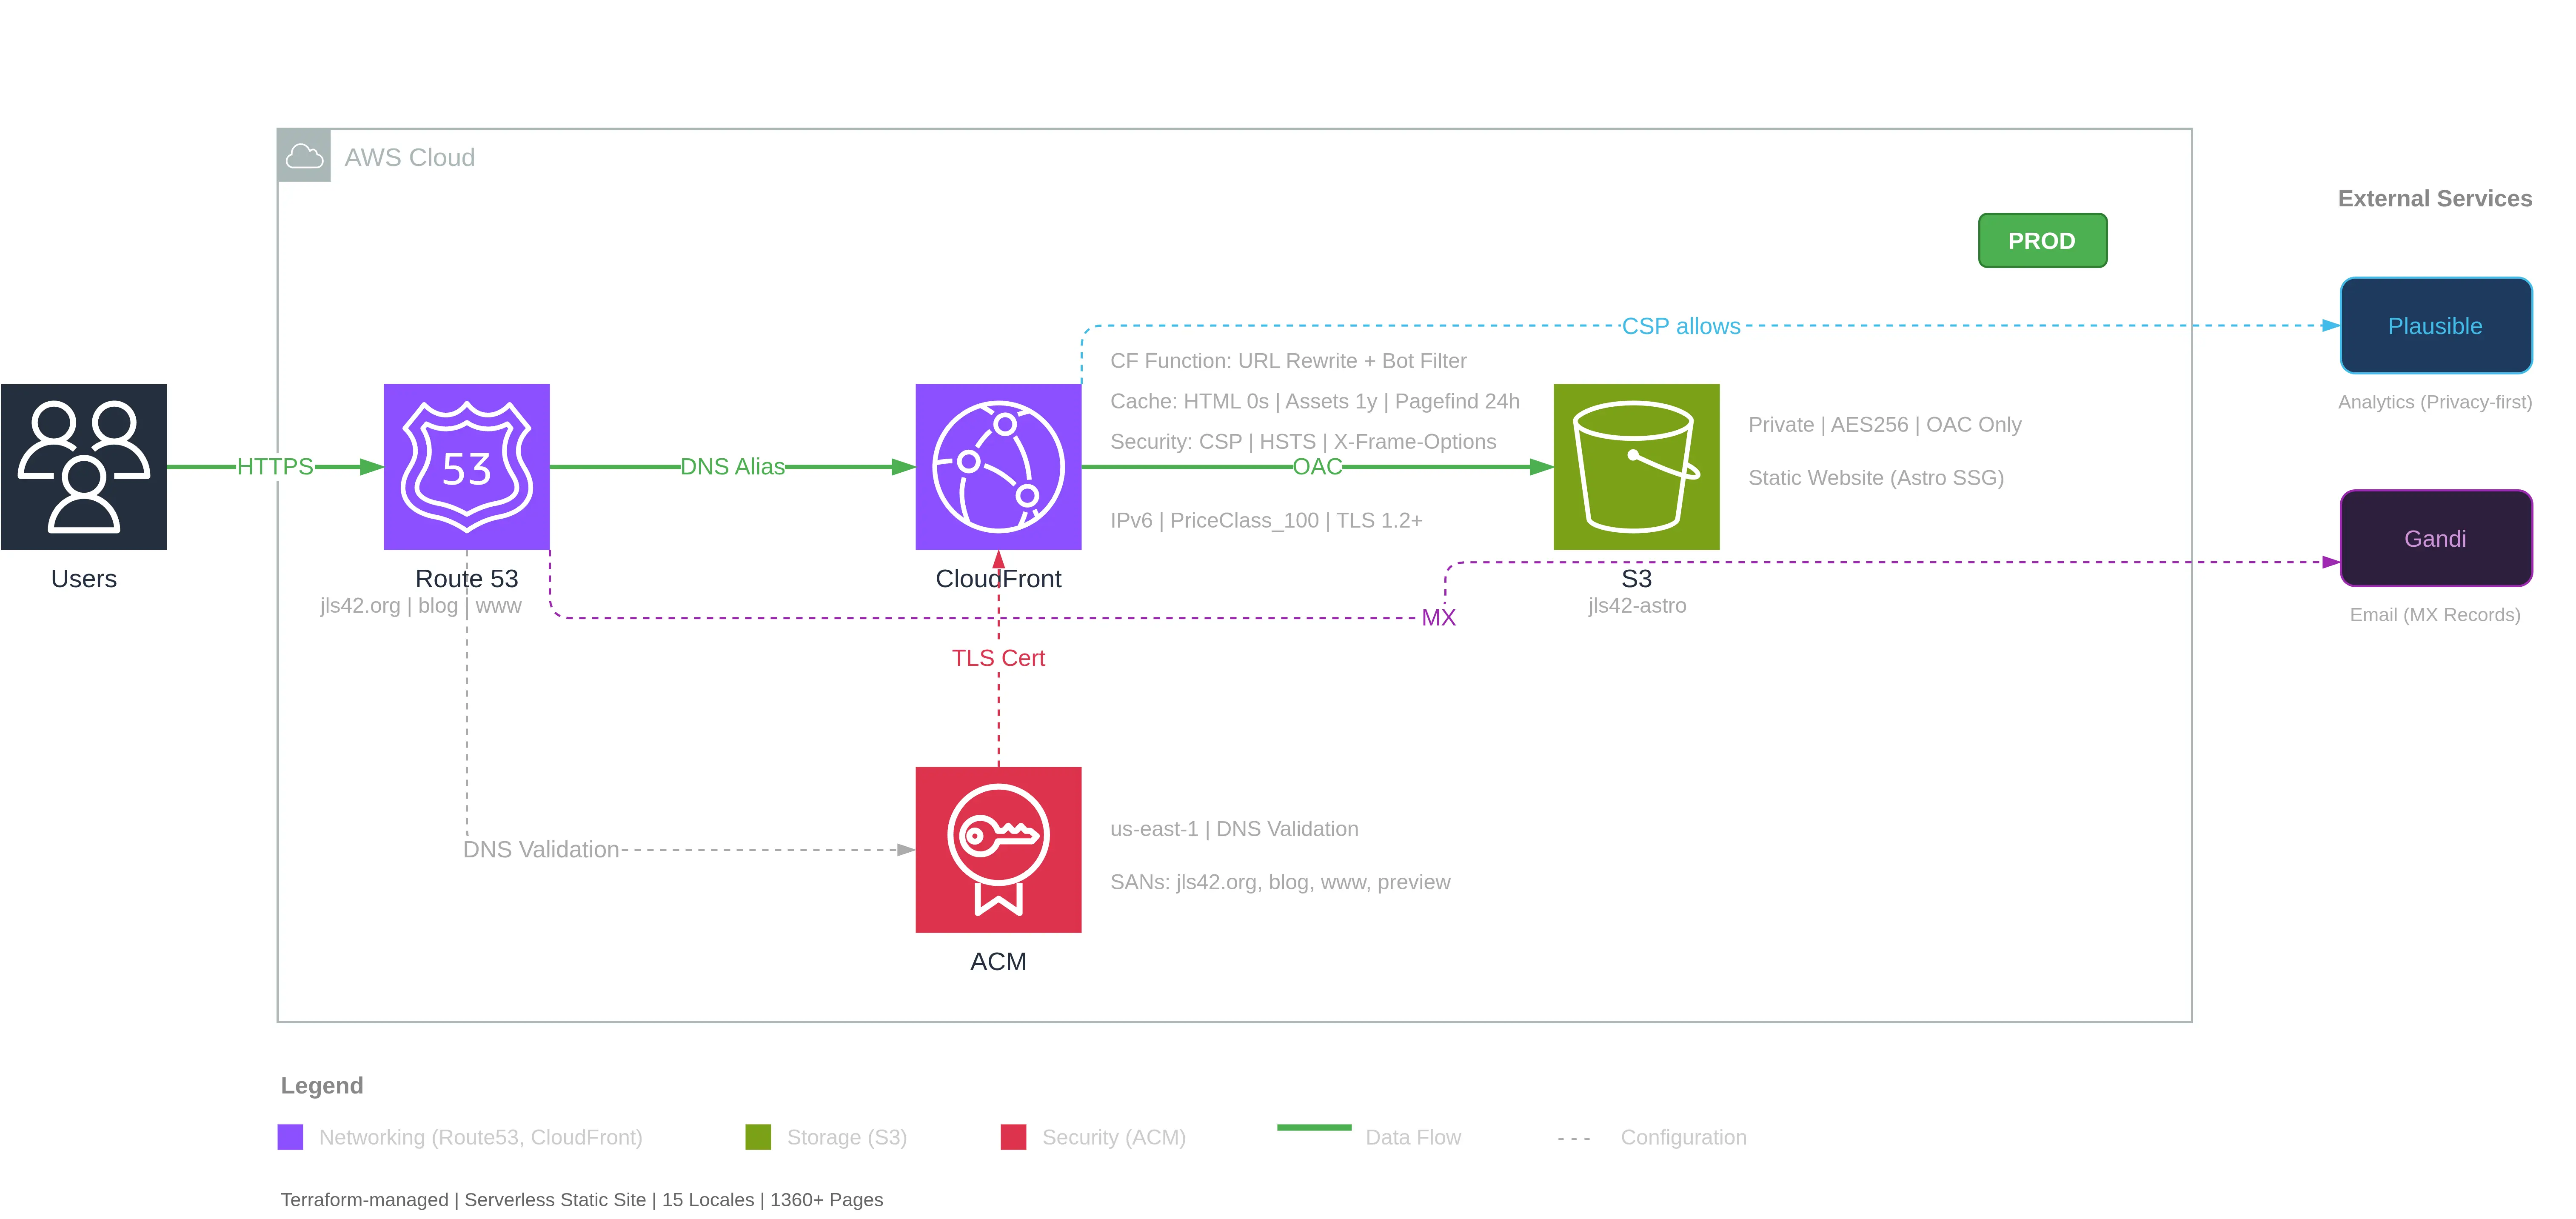
Generated diagram
Here is the final result:
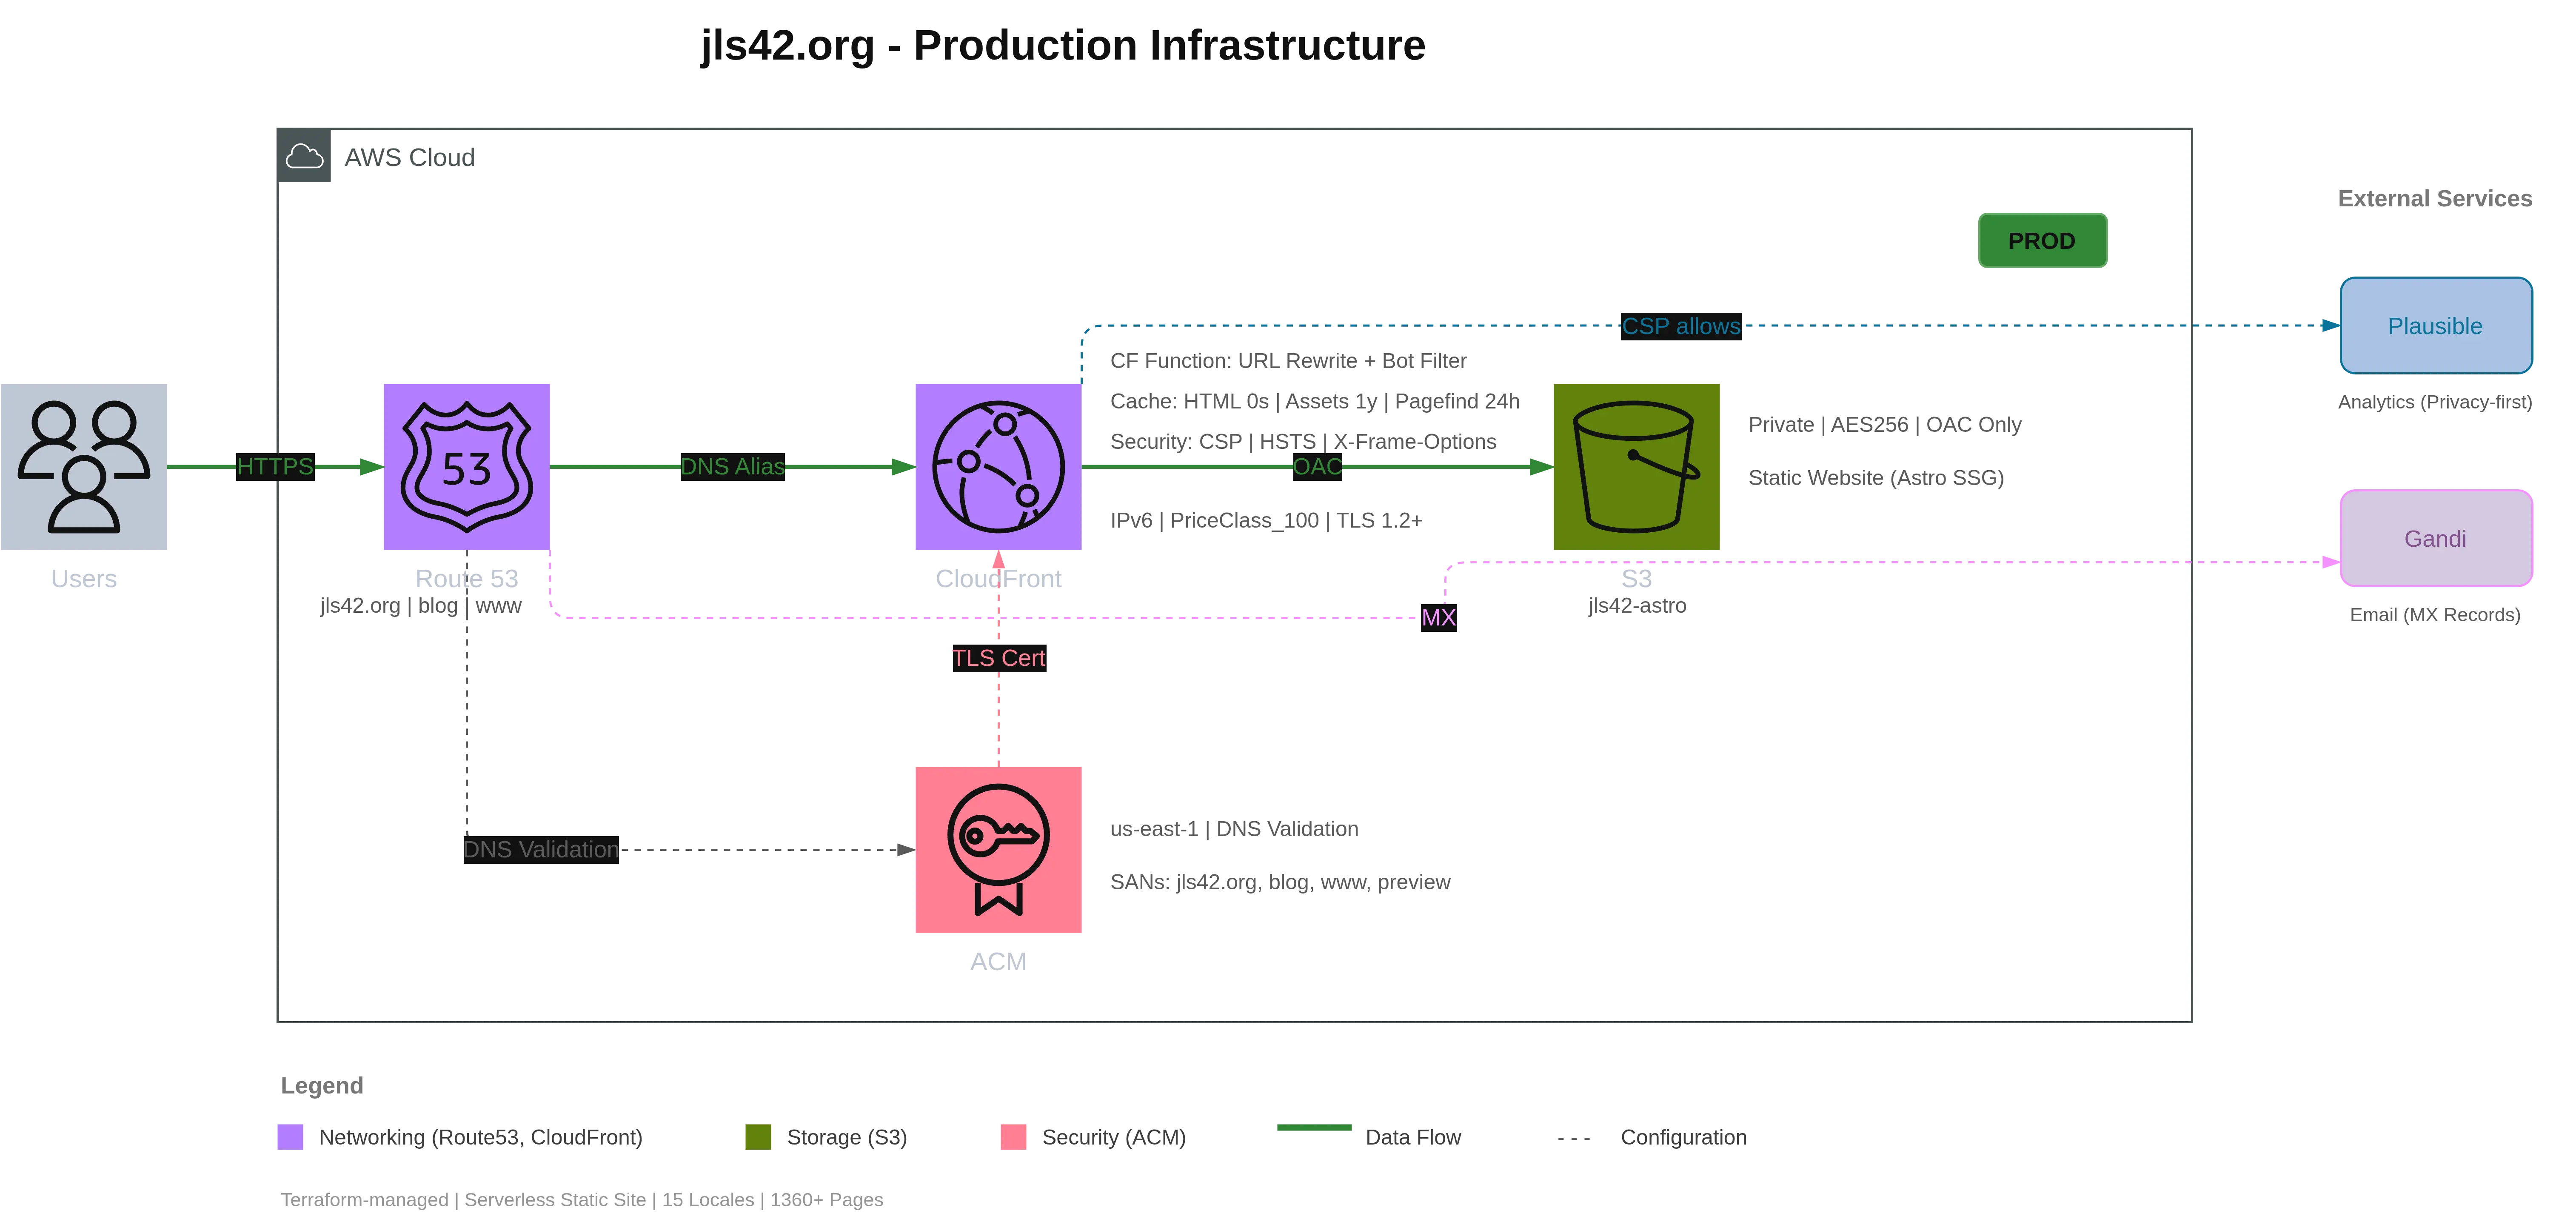
From a simple natural language prompt:
«Analyse en profondeur l’infrastructure de ce projet puis réalise un super schéma de l’architecture AWS comme un pro. Juste l’infra de prod, pas preview ni legacy.»
🇬🇧 “Analyze this project’s infrastructure in depth, then produce a professional AWS architecture diagram. Only the production infra, no preview or legacy.”
Claude Code first analyzed the Terraform files to identify the infrastructure, then loaded the skill /aws-diagram whose instructions allowed it to:
- Create the main components (Users, Route53, CloudFront, S3, ACM)
- Add detailed annotations (cache policies, security headers, bucket config…)
- Draw connections with labels (HTTPS, DNS Alias, OAC, TLS Cert…)
- Add external services (Plausible Analytics, Gandi for emails)
- Generate a legend by category
All while respecting a clean layout with:
- The AWS cloud auto-sized (900×420px)
- Users on the left of the cloud
- External services on the right
- A legend below the diagram
The full workflow: from Terraform to video
I pushed the experiment further by creating a demo video.
Recording
I recorded the diagram generation in real time: 4 minutes 10 seconds of Claude Code reading the Terraform, creating elements one by one, and building the diagram before my eyes.
Post-production with FFmpeg
Four minutes is long for a demo. I used FFmpeg to create an accelerated version with variable speeds:
| Segment | Content | Speed |
|---|---|---|
| 0:00-0:10 | Asking Claude to generate the diagram | 1x |
| 0:10-0:32 | Analyzing the Terraform code | 15x |
| 0:32-0:35 | Skill /aws-diagram detected and launched automatically | 1x |
| 0:35-3:46 | Diagram generation in the browser | 15x |
| 3:46-3:56 | Repositioning labels for better visuals | 1x |
Result: a 42-second video instead of 4 minutes, keeping key moments at normal speed.
Narration with HeyGen
To add a voice-over, I wrote a narration script, split the video into 30-second segments (HeyGen limit) and generated the voice in French. The default voices didn’t suit me, so I used their voice design feature to craft a voice on the fly by iterating on a prompt until I found the right tone.
The final result is the video you can watch at the top of this article.
Second example: Highly Available EKS architecture
To show how well Draw.io MCP works, here is a second, more complex example: a highly available EKS (Elastic Kubernetes Service) architecture. The MCP does all the creation work in Draw.io — I just provided a detailed prompt.
This time I provided a detailed prompt describing the desired architecture:
📋 Full prompt for the EKS architecture
Architecture EKS Hautement Disponible
Génère un diagramme d'architecture AWS EKS avec les composants suivants :
## Services AWS à inclure
### Externes (gauche du cloud)
- Users (icône utilisateurs générique)
### Networking
- Route 53 (DNS)- Application Load Balancer (ALB) - dans les subnets publics- NAT Gateway (3x, un par AZ)- VPC avec 3 AZ
### Compute (subnets privés)
- EKS Control Plane (géré par AWS - représenter séparément)- 3 Node Groups (un par AZ) avec pods à l'intérieur
### Storage
- EFS (stockage partagé cross-AZ)
### Security
- ACM (Certificate Manager)- IAM (pour Pod Identity / IRSA)
### Observability
- CloudWatch (logs et métriques)
## Connexions à tracer
| Source            | Target      | Label               | Style       || ----------------- | ----------- | ------------------- | ----------- || Users             | Route 53    | HTTPS               | Solid green || Route 53          | ALB         | DNS Alias           | Solid green || ALB               | Node Groups | Traffic             | Solid green || ACM               | ALB         | TLS                 | Dashed gray || Node Groups       | EFS         | NFS Mount           | Solid green || EKS Control Plane | Node Groups | kubectl API         | Solid green || EKS Control Plane | IAM         | IRSA / Pod Identity | Dashed gray || Node Groups       | CloudWatch  | Logs / Metrics      | Dashed gray |
Generated result
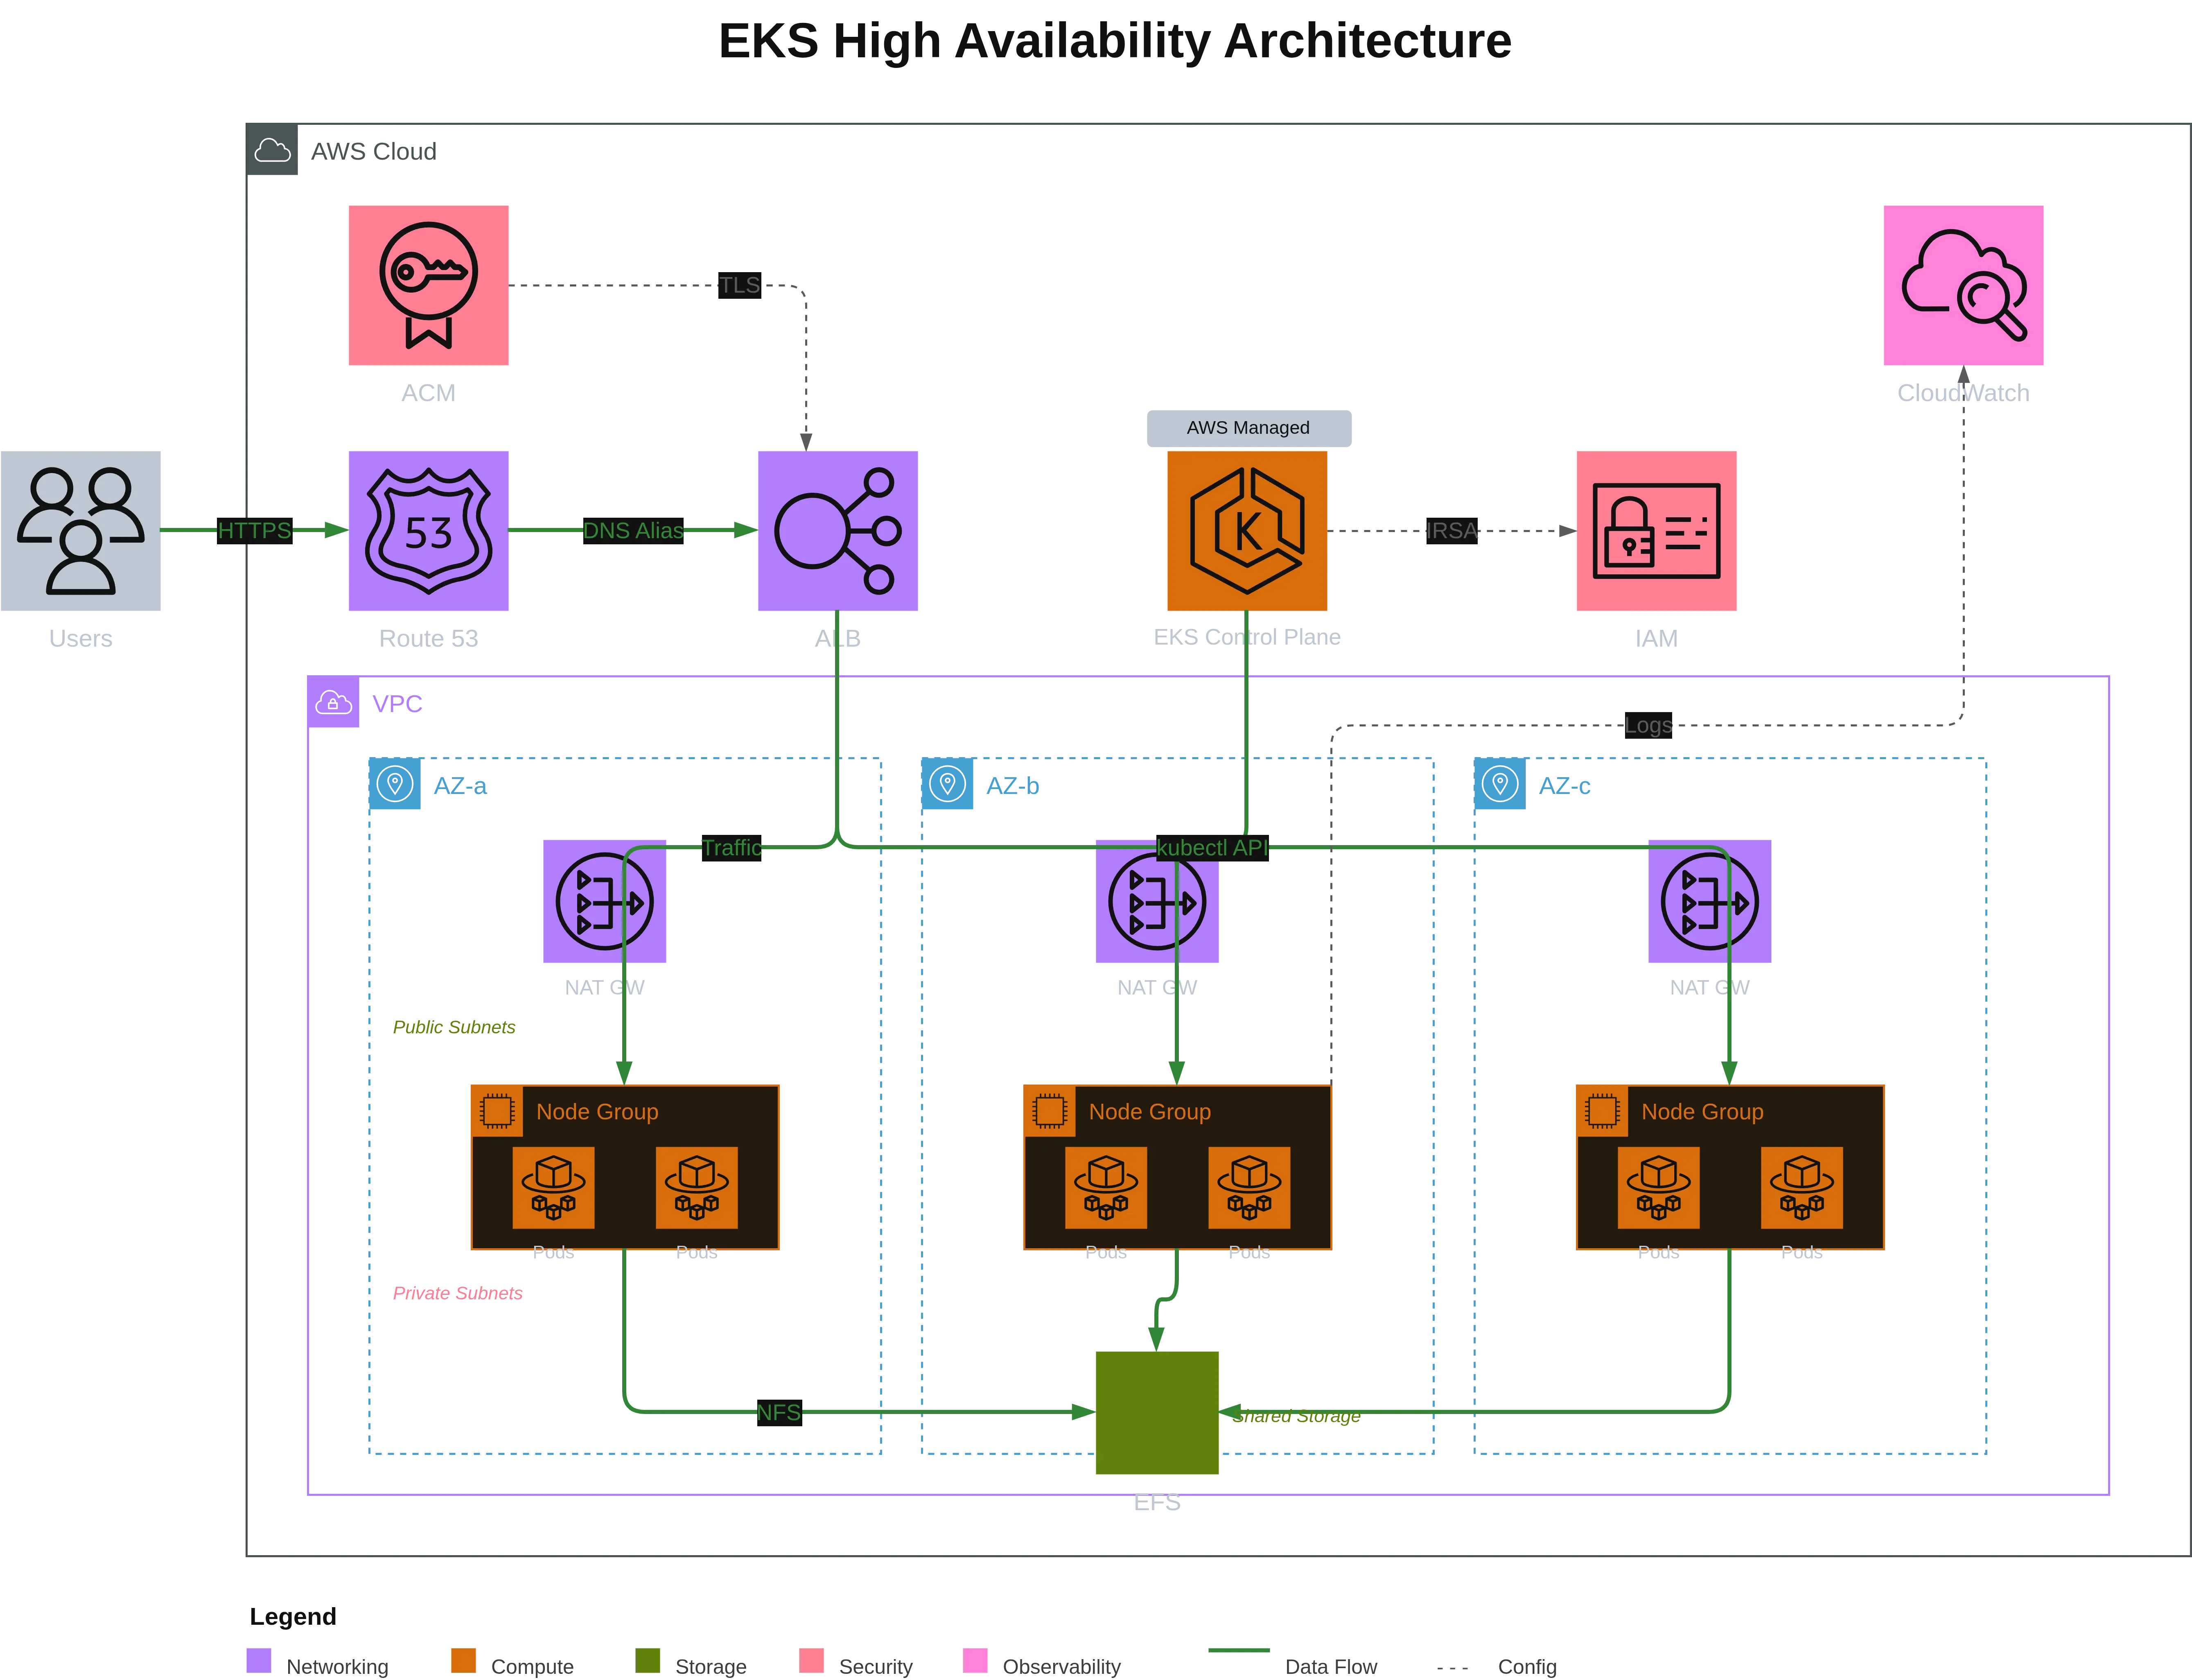
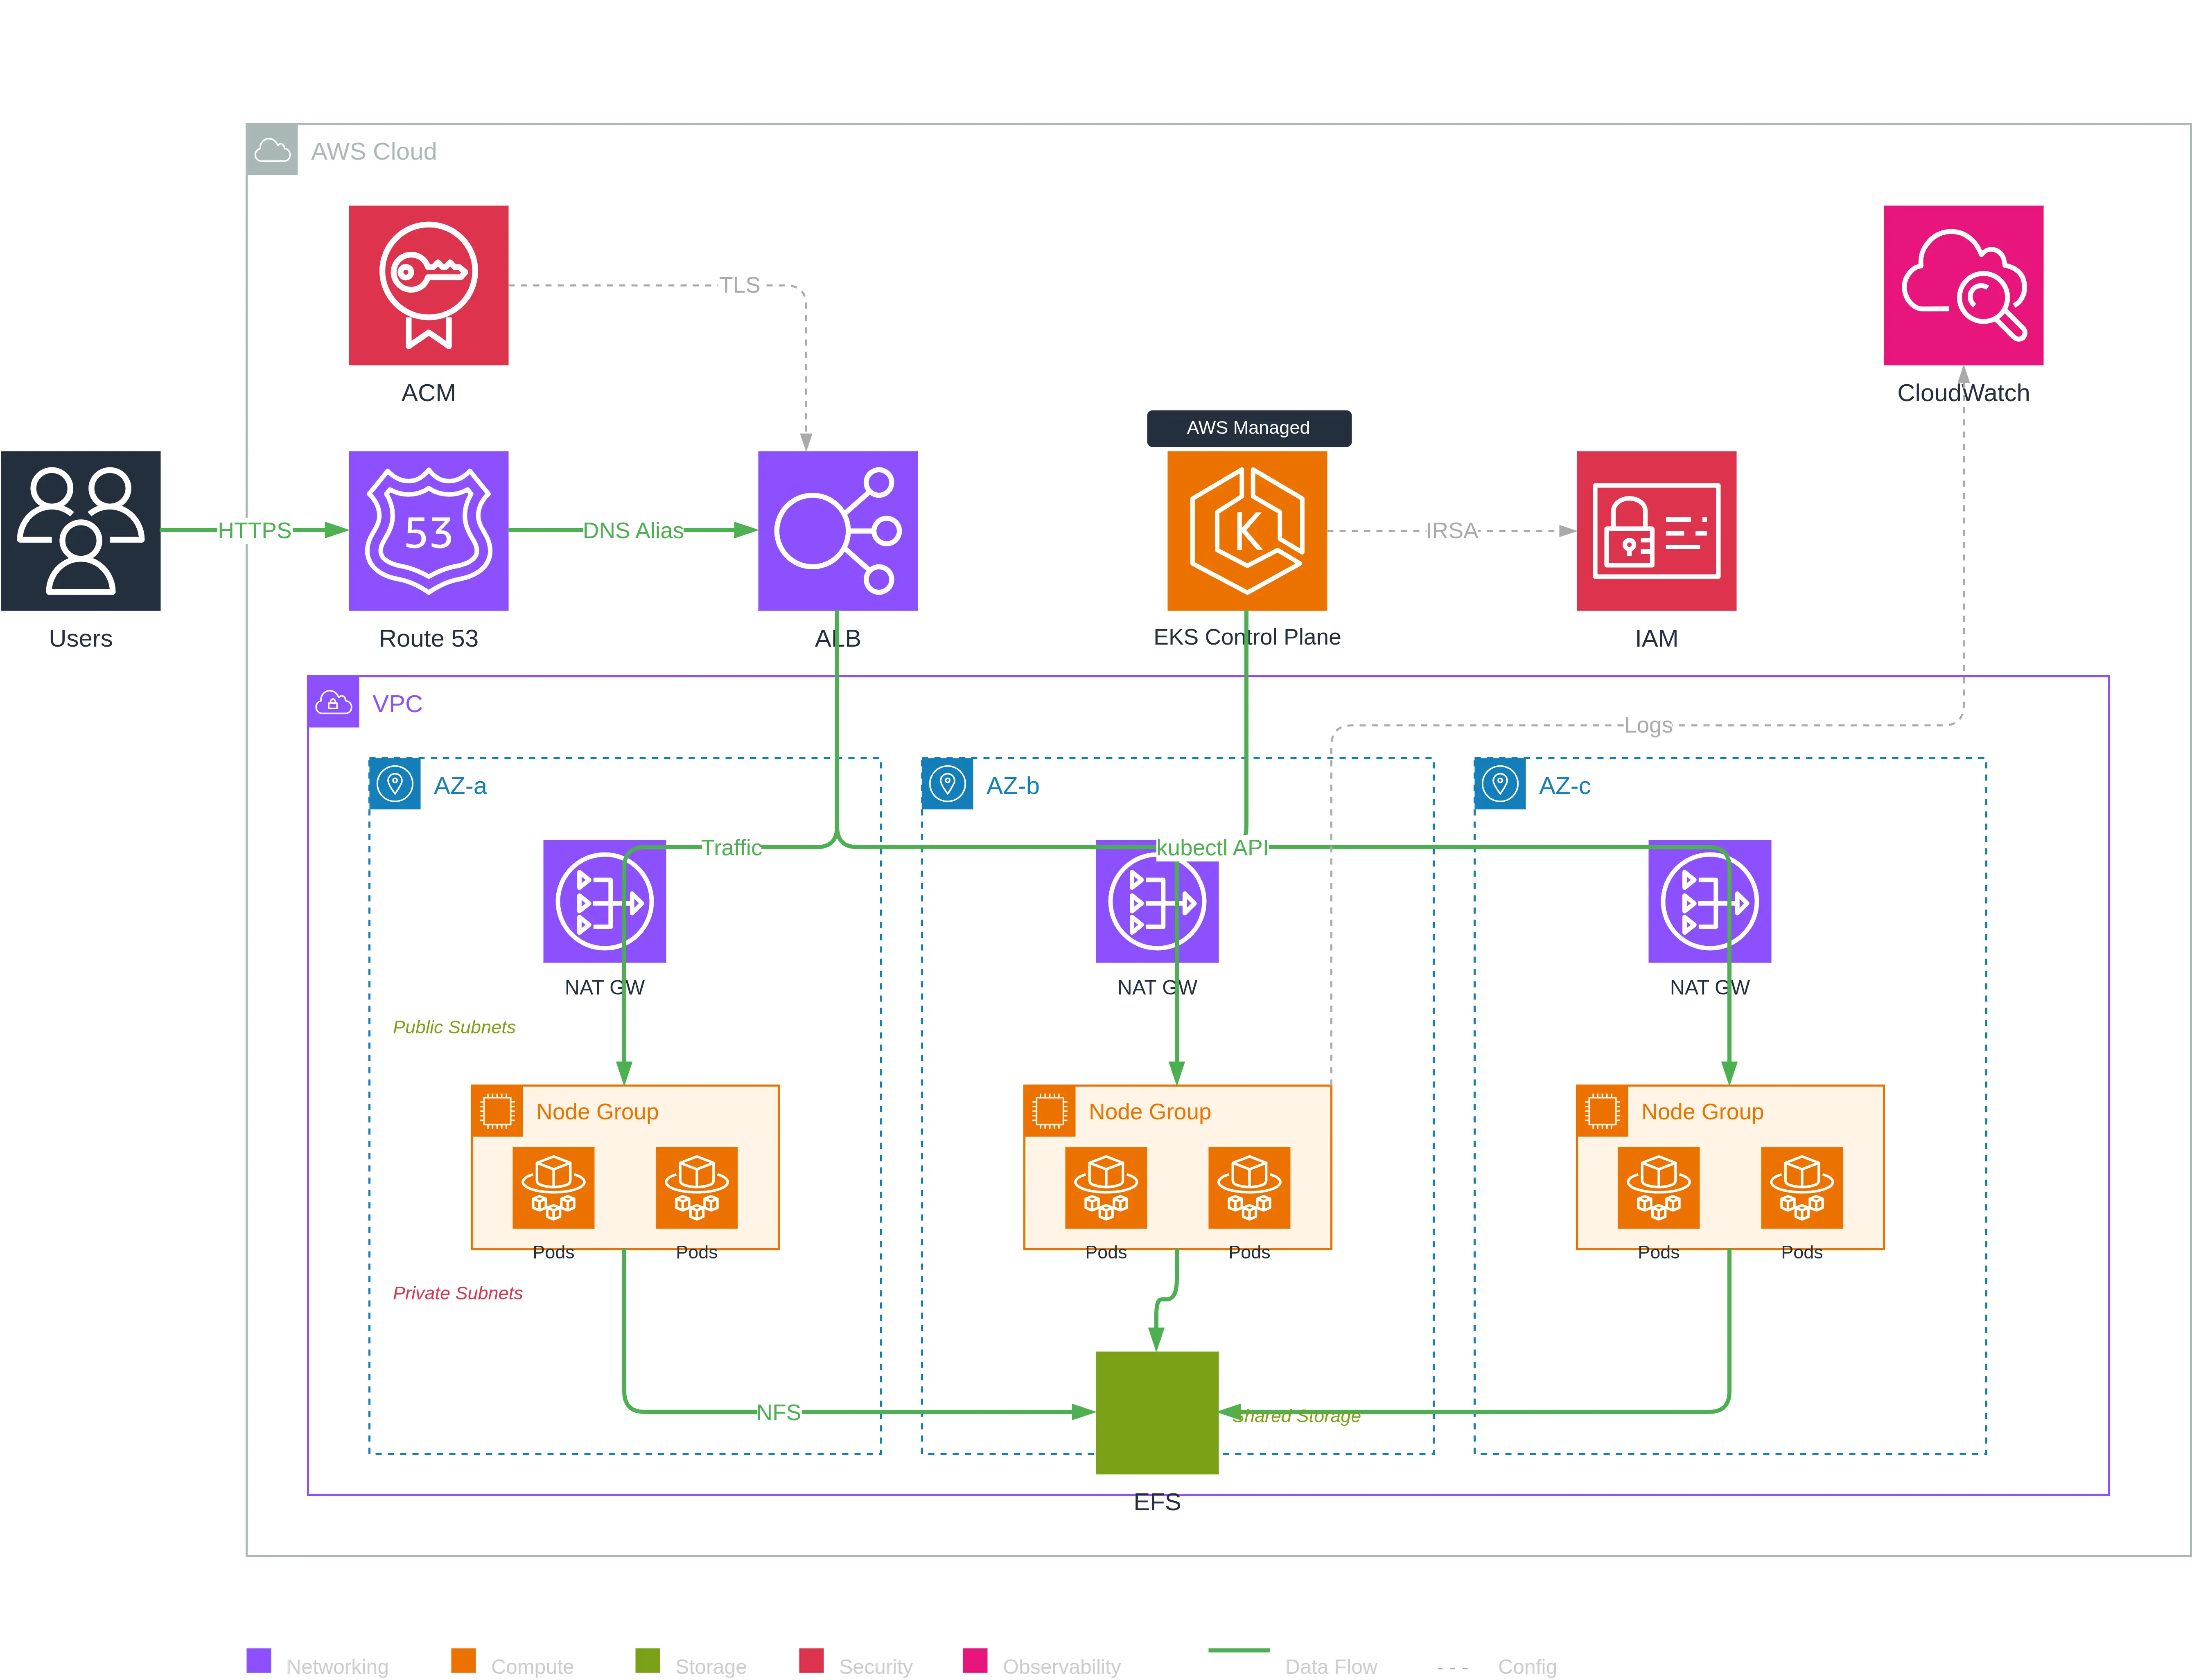
This diagram illustrates a production-ready Kubernetes architecture with:
- 3 Availability Zones for high availability
- Redundant NAT Gateways (one per AZ) for outbound internet
- Node Groups distributed with pods in each AZ
- Cross-AZ EFS for shared persistent storage
- AWS-managed Control Plane visually separated
- IRSA (IAM Roles for Service Accounts) for pod security
The Draw.io MCP correctly interpreted the structure by creating VPC and AZ groups, placing NAT Gateways in public subnets and Node Groups in private subnets. The result provides an excellent starting point to refine visually or fix possible errors — much faster than starting from scratch.
What this project reveals
This experiment highlights several aspects of how I work:
- Automating documentation: code is the source of truth, and diagrams should be derived automatically
- Using the right tools: the Draw.io MCP was exactly what I needed, I didn’t reinvent the wheel
- Encoding rules: skills capture expertise and avoid common mistakes — applicable to any Draw.io diagram, not just AWS
- Testing on real cases: I used my own infrastructure as a playground
- Pushing exploration: from automatic generation to narrated video, each step was a learning opportunity
The skill is now integrated into my workflow. Next time I change the infrastructure, I can regenerate the diagram with a single prompt.
Resources
- Draw.io MCP Server by Ladislav (lgazo)
- MCP - Model Context Protocol by Anthropic
- Claude Code — the CLI tool I use daily
If you use an MCP-compatible coding agent and have infrastructures to document, I encourage you to try this approach. It’s satisfying to watch a clean diagram build itself automatically before your eyes.
Thanks for reading — I hope this article inspires you to experiment!
This document was translated from the fr version into the en language using the gpt-5-mini model. For more information about the translation process, see https://gitlab.com/jls42/ai-powered-markdown-translator